Shocking Truths About the Labor Market and Stock Market Outlook
A look at the true US labor market and unemployment numbers, GDP vs. the S&P and DOW, and stock market outlook for both U.S. and Canadian stocks.
by Equedia5 minute read


Former Commissioner Reveals a Shocking Truth About the US Labor Market and the Stock Market Outlook for Both Canadian and U.S. Stocks
Bernanke is once again playing with the market and controlling the minds of retail investors while giving wavering input to the algo-machines.
A batch of better-than-expected earnings from large corporations also fueled the rally.
Despite a lower close on Friday, the Dow and the S&P 500 climbed to record intraday highs on Thursday. The benchmark S&P 500 is now up nearly 18% for the year.
The TSX also hit a six-week high Thursday, but is still a long way off from its record close above 15,000 in 2008, and still lagging U.S. equivalents for the third year running.
Does the recent bounce suggest that the worst is over for the Canadian market?
The Canadian Market
The resource-heavy TSX has been hit hard by lower commodity prices but that may change soon according to BMO Capital Markets’ latest commodity report:
“The correction has likely been overdone in some areas, and commodities should stabilize and recover moderately through 2014 as global growth regains momentum.” – Earl Sweet, senior economist, BMO Capital Markets.
Bank of America Merrill Lynch told us on Thursday that the TSX materials sector is one of the most oversold sectors in the world, with a deviation of 34.3 from its 200-day moving average. The only sectors more oversold? Global gold miners and South African materials.
Given that about one-third of the TSX is comprised of materials, signs of a bottom are close. From its peak in April 2011, the TSX materials sector is down nearly 50%
From a technical perspective, things are also improving on the Canadian front, including the stock-to-bond ratio which is now pushing above its 200-week average. The last two times that happened, in September 2004 and December 2010, Canadian stocks outperformed bonds over the following months.
Meanwhile, according to foreign securities data from Statistics Canada, Canadian stock flows are improving relative to bond flows. More importantly, the data shows that foreign buyers are interested in Canadian equities again, while Canadians are now selling out of U.S. stocks and potentially buying back into Canadian stocks.
Via Statistics Canada:
“…Foreign investors purchased $1.2 billion of Canadian equities in May, adding to April’s $2.2 billion. This activity was widespread across sectors, notably gold, energy, bank, communication and transportation.
…Canadian investors reduced their holdings of foreign securities by $1.6 billion in May, the largest divestment since August 2012, led by sales of US securities.
Canadians sold $2.2 billion of foreign stocks in May, all US instruments. This marked the third consecutive month of divestment in US equities. The net sale of $2.5 billion of these instruments was the largest since October 2008, when US stock prices declined significantly.”
Canadian Investment in Foreign Securities

Source: Statistics Canada
If the trend continues, we may come out of the summer and end the year on a high note.
However, I remain cautious on anything commodity related as there are more than just supply and demand fundamentals at work. There are chances
of another credit disaster from a major nation, and we may witness more growth issues exposed in China; both of which will hurt commodity prices, which means Canadian stocks could continue to suffer.
For now, Canadian stocks may finally be in a better position than their U.S. counterparts.
U.S. Stocks
U.S. stocks continue to climb in bull market fashion. But how does the current market compare to the peak of 2007, prior to the 2008 crash?
During the peak of 2007, the 12-month trailing P/E ratio (as reported earnings) was 17.7x.
The current 12-month trailing P/E ratio is 18.3x.
That suggests that stocks are now more expensive than they were during the 2007 peak.
Adding to the euphoria, U.S. stock prices are now outrunning corporate profits, which also suggests that stocks are running at a faster pace than it should.
While corporate earnings last week blew away analyst expectations, we have to remember that analysts expectations have already been lowered substantially; anything shy of their already-lowered expectations would mean total disaster.
It’s not hard to beat earnings expectations when you’re not expecting much to begin with.
The Inverse Correlation
Despite reaching yet another all-time high, analysts continue to tell us that U.S. stocks are cheap.
That’s funny because it would imply there is now an inverse correlation between GDP estimates – which continue to see downward revisions – and the Dow and S&P, which continue to soar higher.
The stock market is now higher than it was in 2007, yet GDP is down and unemployment is up.
Seasonally Adjusted Unemployment Rate

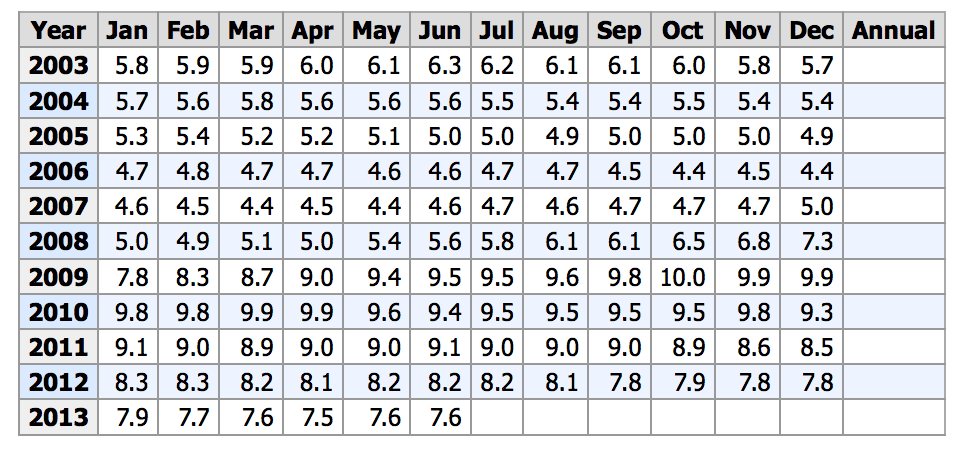
Source: Bureau of Labor and Statistics
Go figure.
The Truth About the Labor Market
 measure of the state of US labor – called U-6, which includes the underemployed – jumped sharply in June to 14.3 percent from 13.8 percent the month before.
Hall reckons there are millions of U-6 people on top of the 4.5 million long-term unemployed.
…”This has been a very slow, very bad recovery,” he says. “And I think the numbers have really struggled as a result. In fact, I’ve been very disappointed in the coverage of the numbers.”
…There are other problems with numbers coming out of BLS, according to Hall. And they will just add to the confusion.
All parts of Washington’s data-collecting machine adjust to smooth out the bumps caused by the seasons of the year. But the recession that started five years ago was so severe and the recovery so anemic that the seasonal adjustments have been thrown off.”
Well said.
To sum it up: The true rate of unemployment may be closer to 10.6%.
Good job Bernanke.
Until next time,
Ivan Lo
The Equedia Letter