Silver Chart Analysis for October 16, 2019
A local broker contacted me to take a look at silver and here is a weekly chart for it. A look at the weekly silver chart analysis.
by Equedia1 minute read
A Look at the Price Action of Silver
By John Toporowski
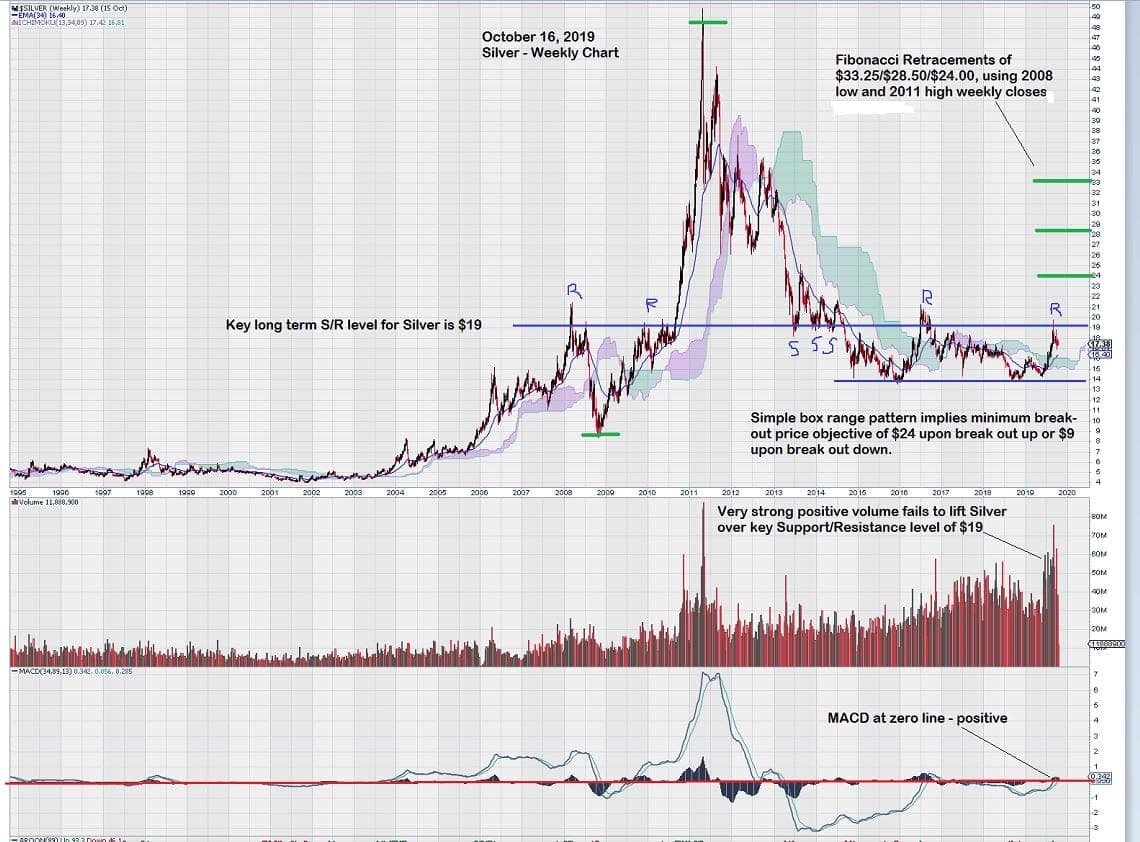
A local broker contacted me to take a look at silver and here is a weekly chart for it. Best guess is more sideways trade within the defined range of $14 – $19. Trend momentum and MACD both slightly positive. Massive positive volume failed to lift the price over $19.
This can be viewed two ways:
1. The negative view is that record up volume did not impact price as one would have expected; ie. a more sustained push over $19.
2. The positive view is that any overhead resistance below the important $19 support/resistance level has gone from weak hands to strong hands and further buying interest can have a more positive effect on price.
Take a look: