


TSX Gold Index Weekly Chart Analysis Update
A few months ago, we provided the readers of EQUEDIA a weekly chart for the S & P TSX Global Gold Index. Here is another look at that very same chart and another chart that shows what has happened since.
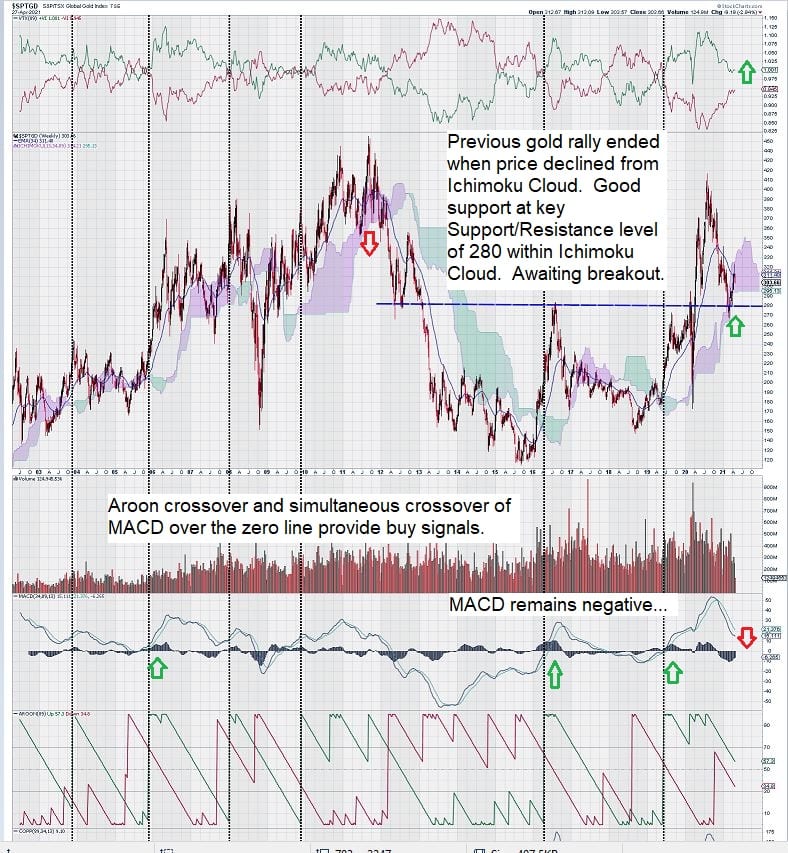
In the weeks and months ahead, what we are watching very closely is MACD.
Our MACD settings are unconventional and are best to measure when there is a sentiment change in a market. By using MACD with long-dated variables, we will never get a signal at the “absolute bottom” or the “absolute top.” But, in exchange, we have a strong sense of trade direction and are almost always on the “right side” of the trade.
Our focus was on MACD, the Ichimoku Cloud, and the “line in the sand” multi-year horizontal support/resistance level of 280.
The concerns we had for the TSX Gold Index were also clearly noted on the chart. We did not want to see it break below the Ichimoku Cloud.
There was support, as expected, at the 280 level.
Now, here is a weekly chart for the S & P TSX Global Gold Index that you can compare to the one above:
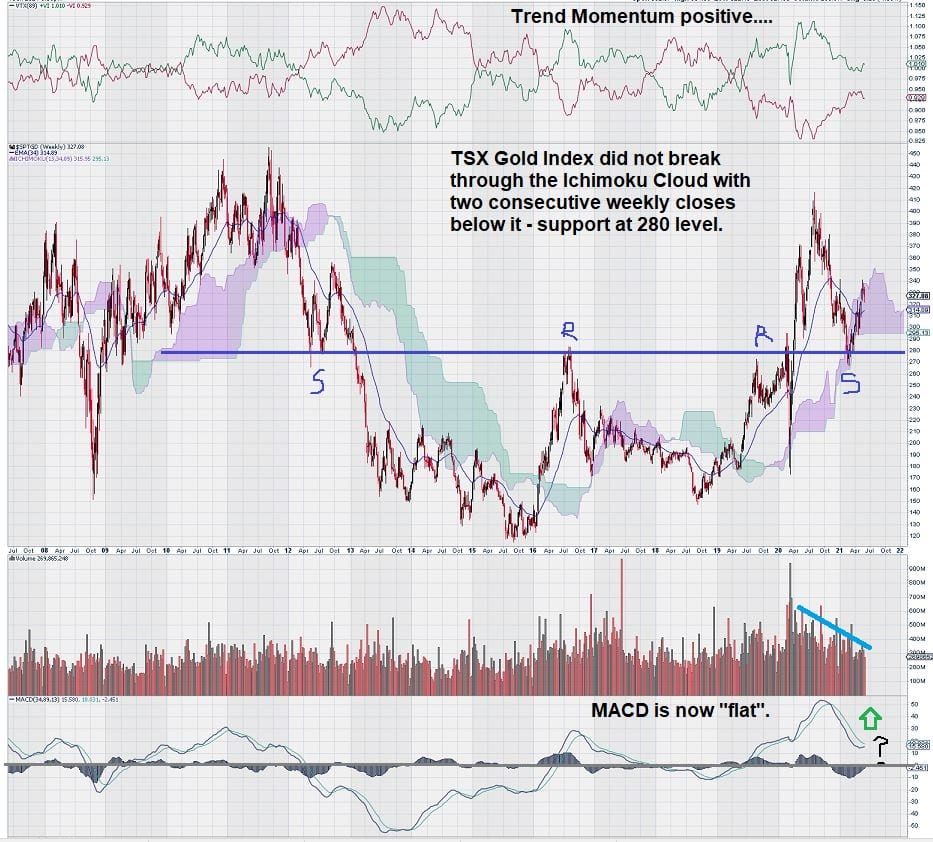
This chart shows good improvement for MACD by way of its “flattening.”
Although a crossover of the signal line over the trigger line has not yet occurred, it now seems much more likely than just a few months ago when both lines were declining in unison.
A strong reliable buy signal would be generated upon a crossover taking place. Positive crossovers of MACD, on trend settings, that are above the zero-line act as confirmation that a consolidation is complete. The steady decline in volume is supportive of a consolidation rather than a loss of control of the market by the bulls to the bears.
Summary & Wrap Up
The TSX Global Gold Index is a strong proxy for investor interest in gold stocks. It may be on the brink of an important resumption of its uptrend that began from the recent lows at the end of 2015.
Another factor to bear in mind, something that has not been seen since the last gold cycle of the ’70s and ’80s, is how political uncertainty impacted gold.
Some of us are old enough to remember the volatility of the gold markets, both physical and equities, when there were flare-ups in the Middle East.
The current American administration has become more broadly recognized as feeble, weak, and indecisive. The Carter administration is a reminder of how weak American leadership can embolden other countries’ leadership to pursue policies that are not in America’s interest.
This is coupled with what many perceive as a destructive domestic policy agenda that continues to divide the country along political lines.
While some prefer to be like an ostrich with their heads in the sand – the gold market has straightened up and taken notice. The recent volatility in the way gold has traded tells us that political uncertainty is becoming a more and more certain factor that is impacting the price of gold.
-John Top, the technical trader