Titan Mining – Testing a Key Break-out Level
Some charts jump off the page and say, “Look at Me.” This is what the daily chart for Titan Mining (TSX:TI) looks like today.
by Equedia1 minute read
(Chart Article 001 – 2021)
Some charts jump off the page and say, “Look at Me.”
This is what the daily chart for Titan Mining (TSX:TI) looks like today.
What catches our attention is that the power downtrend line is more or less at the same level as the EMA (89) line and both of these resistance levels are being tested from below via a strong move up in price.
We checked for any news that might provide a hint of the strong recovery in the stock price but could find none.
Let’s take a look at the daily chart for Titan:
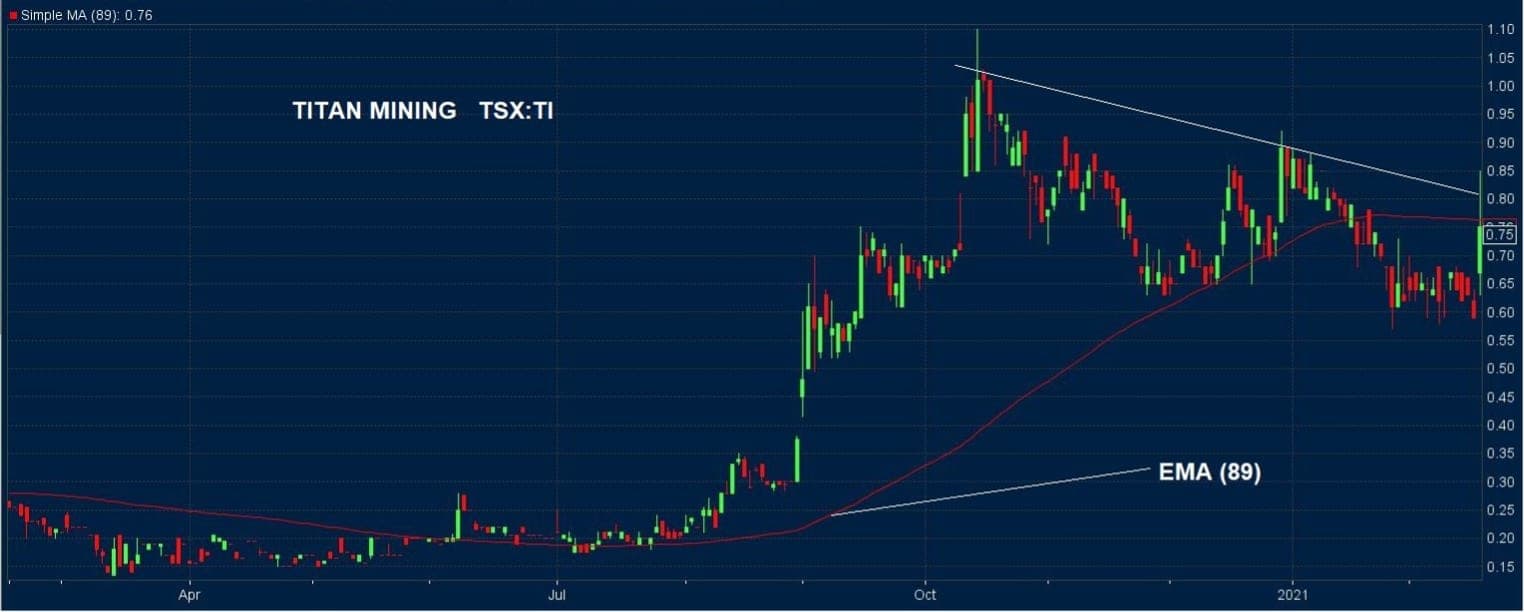
Here we can see that the 27% one-day gain puts price up against the EMA (89) and is almost testing the power downtrend line. The shares traded briefly above this line but closed below it.
So, what is a good “trading strategy”?
We like to see at least two consecutive closes above key levels and prefer that the second candlestick is a “better one” than the first.
Volume follow-through would also be another positive sign for better things ahead.
This is one to watch for active traders, especially as it closes above the $0.75 – $0.80 level. Remember, consecutive closes are what we require to consider entering trades.
Titan is controlled by the powerful Augusta Group, which has had a string of recent successes in the resource development sector.
Further information is available on their corporate website: